XRP Price Flashes Symmetrical...
12 April 2025 | 3:00 am
XRP’s recent recovery has sparked fresh optimism among traders, but what’s happening behind the scenes tells an even more compelling story. This isn’t just a typical bounce; the charts reveal a calculated shift in momentum. Technical indicators like the Relative Strength Index (RSI) and Moving Average Convergence Divergence (MACD) are beginning to align, suggesting that XRP is approaching a crucial decision zone.
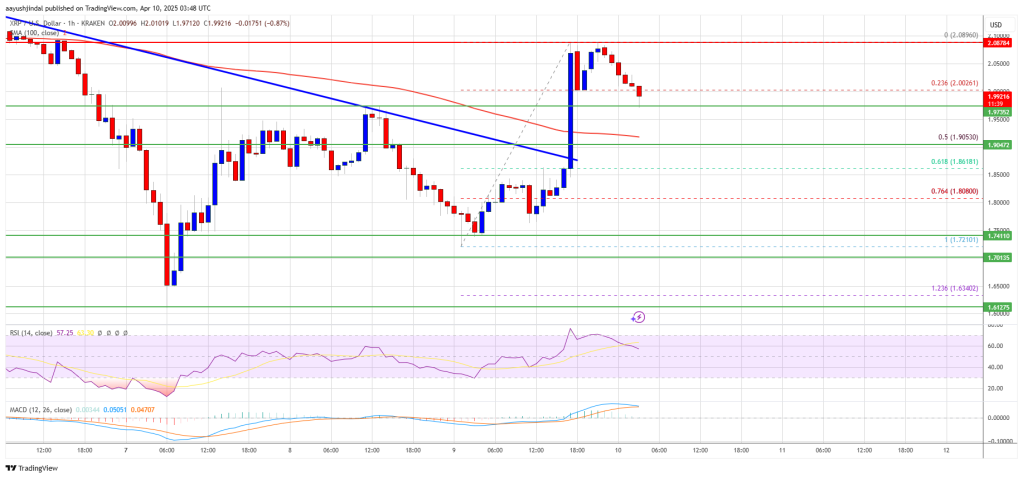
Following the recent downturn in the market, the price is now on a bullish recovery after testing the $1.7 key support level with increasing conviction. If the current momentum continues and resistance zones give way, XRP could be on the verge of a significant breakout. However, failure to build on this momentum could trap the token in another consolidation phase or a deeper retracement.
In a recent post on X, crypto analyst Javon Marks pointed out that XRP’s MACD is approaching a critical breaking point, potentially signaling a shift in market momentum. He emphasized that this MACD indicator is showing signs of a bullish crossover, which could mark the start of a strong upward movement.
Coupled with this, Marks highlighted that XRP is currently holding a key Regular Bullish Divergence, where the price has been making lower lows while the MACD is showing higher lows. This indicates a weakening of bearish pressure, setting the stage for a potential reversal.
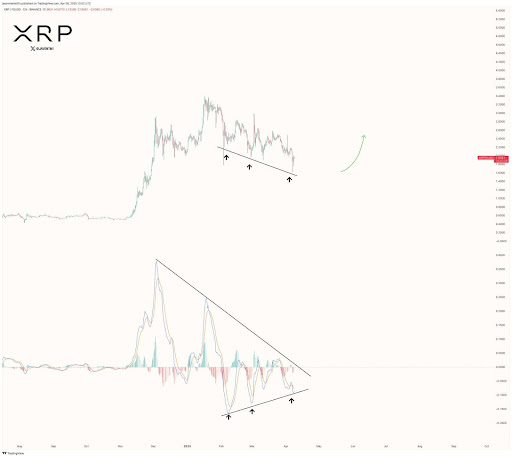
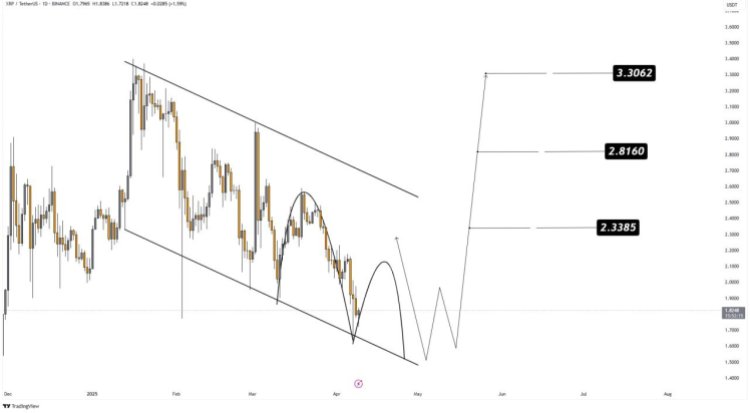
Marks suggested that this technical setup could be the catalyst for the bulls to take control, potentially leading to a powerful move that breaks through current resistance levels. With this convergence of bullish signals, XRP may be primed for a rally back toward the $3.30+ range, continuing its previous uptrend.
In order to fully understand the future movements of XRP, it’s crucial to pinpoint the key levels that will either drive the price higher or cause a reversal. Firstly, the breakout zone for the altcoin lies around the $1.97 resistance level.
If the price manages to surpass this threshold with strong volume, it could trigger a surge towards higher levels, including $2.64 and $2.92. This breakout would likely confirm the upward momentum suggested by the MACD and the regular bullish divergence.
On the other hand, a rejection at the $1.97 resistance level might signal a lack of buying interest. Should the asst fail to break above this level, the price could pull back toward lower support levels like $1.7 or even $1.34. A failure to hold these support levels would trigger the potential for a more substantial downturn, with bears regaining control.
12 April 2025 | 3:00 am

12 April 2025 | 8:50 am

11 April 2025 | 10:34 pm
12 April 2025 | 10:00 am
12 April 2025 | 2:00 pm
13 April 2025 | 12:00 am