KIP Protocol Denies Involvemen...
25 February 2025 | 2:45 am

Statistics show that the Ethereum 2.0 deposit contract has exceeded 6 million ether this week as more than $12.4 billion worth of ethereum is held in the contract today. Onchain metrics show that Ethereum has seen some significant drawdowns in recent times and decentralized finance (defi) activity has slowed compared to last summer’s statistics. Despite the onchain dips, this year ethereum markets outperformed bitcoin in Q1 and Q2.
There’s been a lot of focus on the Ethereum (ETH) network recently as the Ethereum 2.0 deposit contract now commands more than 6 million ether. Meanwhile, Ethereum participants are getting ready for the highly anticipated EIP1559 upgrade and London hard fork.

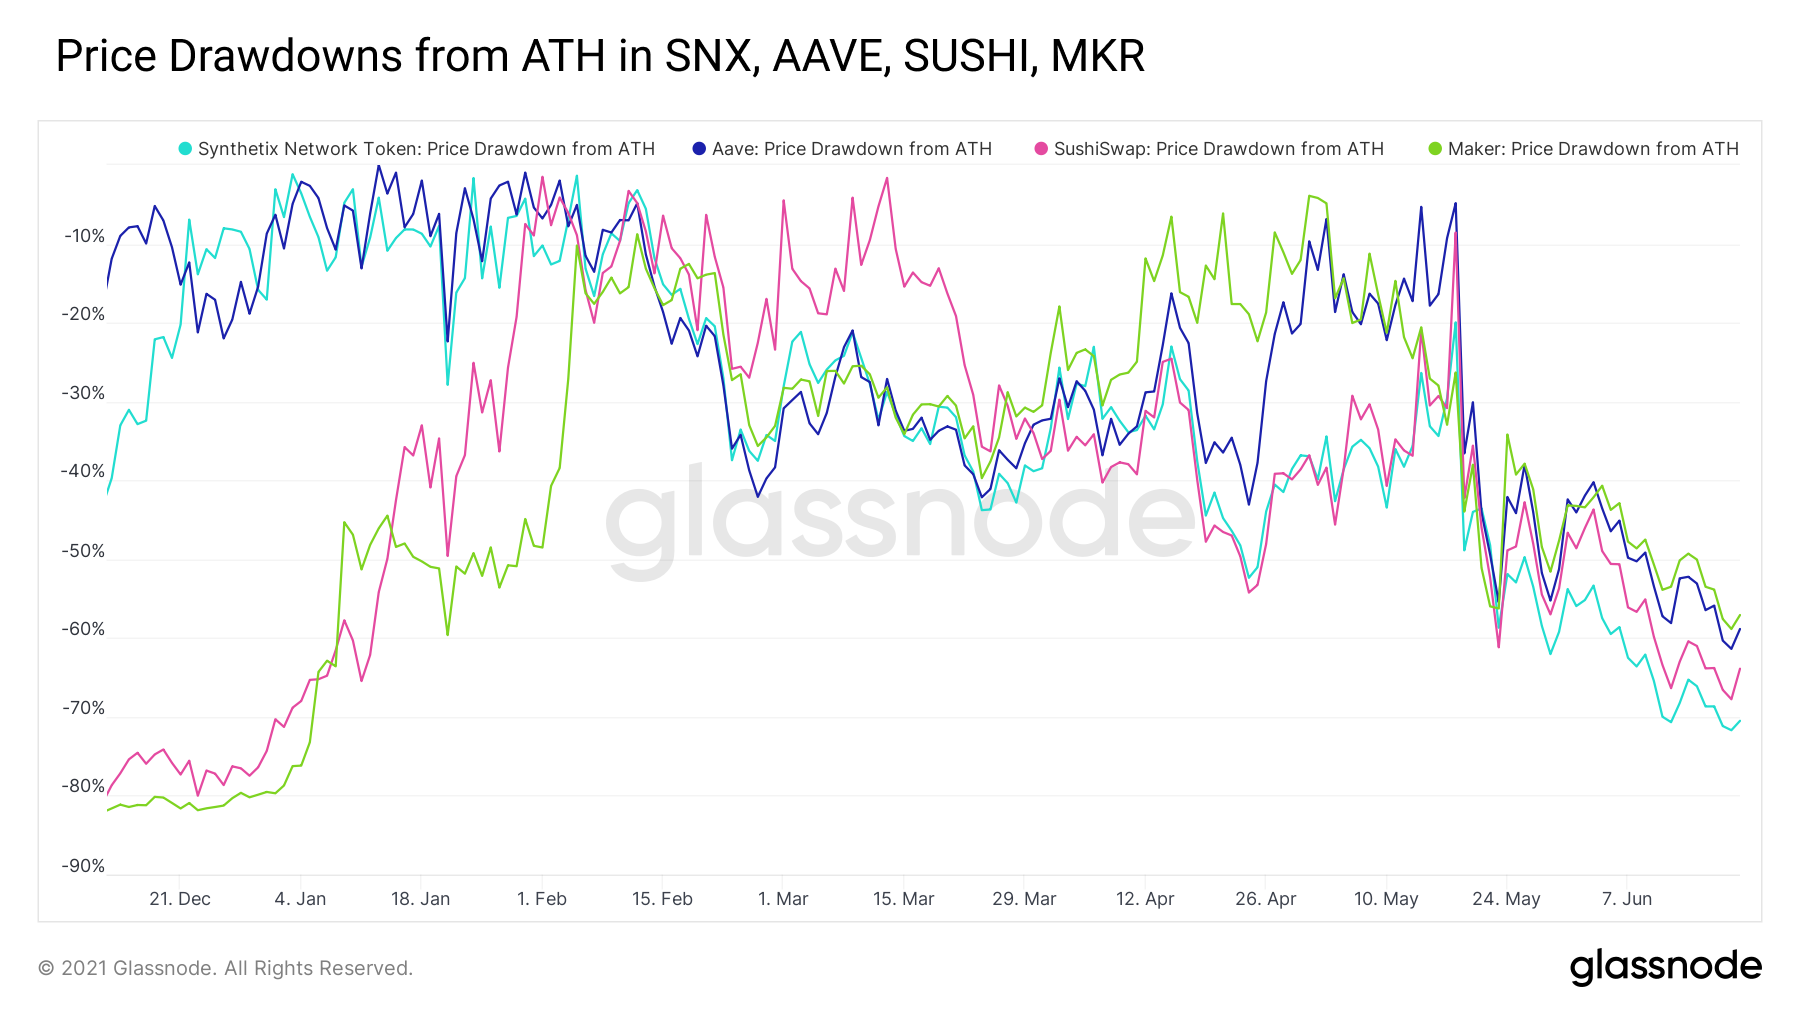
“Growth in new and existing activity throughout defi has taken a hit, as many participants move into a risk-off mindset amidst -60%+ dips from ATH across most governance tokens. While on-chain activity is no longer increasing as a % total month-over-month, year-over-year growth remains massive,” the Glassnode defi study details.

Even though ethereum has managed to make larger gains in comparison to other crypto assets and climb back above the $2K handle, research shows the network has seen some big onchain drawdowns. For instance, The Block Crypto’s Lars Hoffmann shared some insights on Ethereum’s onchain activity on July 1 via Twitter.
“As expected, most metrics had severe drawdowns (with ETH metrics having a higher beta),” Hoffmann tweeted. “While we are basing at high levels YoY, the parabola for most metrics is broken. Total adjusted on-chain volume declined by 46.6% to $572.7bn.” Hoffmann added:
As for [ethereum] futures, volume declined by 49.3% to $862bn. [Ethereum] monthly options volume declined by 68.8% to $5.19bn, yet still higher than at any time in Q1.
Besides the noticeable drawdowns, there have been some positive Ethereum metrics in addition to the 6 million ether locked into the ETH 2.0 contract. For instance, the ether supply on exchanges is the lowest since November 2018. Glassnode’s report shows that defi gas prices have dropped considerably in recent times.
“Gas prices have returned to early defi Summer levels from 2020, so much so that traders willing to deploy patience can even get away with a single-digit Gwei gas fee during off-hours,” Glassnode’s defi study details.
ETH supply on exchanges lowest since Nov 2018 👀 pic.twitter.com/rQiGQeSb4N
— Documenting Ethereum 🦇🔊 (@DocumentEther) July 2, 2021
The latest crypto market insights from Unfolded.io show that the Ethereum network had “about 200K more daily active addresses than BTC on Sunday, June 27th. This was only the third day since January 1st, 2017 that ETH has had more active addresses than BTC.”
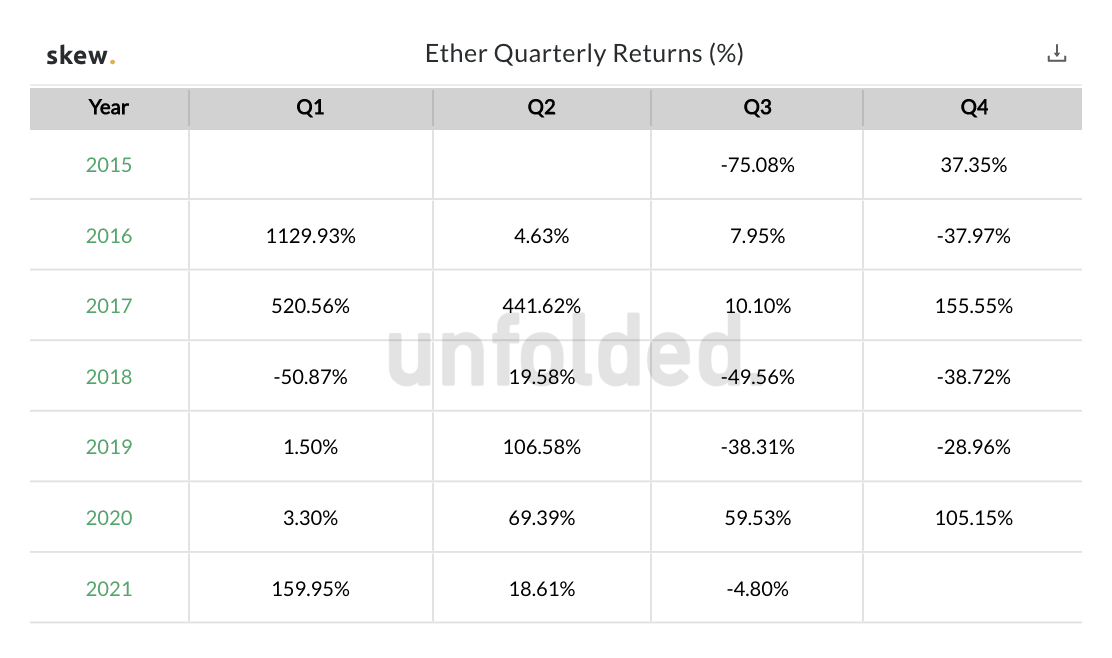
In fact, Unfolded.io data shows that Bitcoin saw its “worst Q2 performance in over 8 years” and “despite high correlation with bitcoin, ethereum outperformed BTC in Q1 and Q2.” On Friday, bitcoin dominance levels are around 45.7% while ethereum’s dominance is around 17.6% of the entire $1.358 trillion crypto market cap.
What do you think about the 6 million ether locked in the Ethereum 2.0 contract? What do you think about ether outperforming bitcoin in Q1 and Q2 this year? Let us know what you think about this subject in the comments section below.